Use of GIS in Smart City Projects - 04/10/2018
Managing and Visualising Geospatial Data in a User-friendly Environment
The smart city concept is developing very quickly around the world, because it provides a comprehensive digital environment that improves the efficiency and security of urban systems and reinforces the involvement of citizens in urban development. This concept is based on the use of geospatial data concerning the urban built environment, the natural environment and urban services. The successful implementation of a smart city project requires the development of a digital system that can manage and visualise the geospatial data in a user-friendly environment. The geographic information system (GIS) offers advanced and user-friendly capabilities for smart city projects. This article shows how a GIS could help in the implementation of smart city projects and describes its use in the construction of a large-scale model of the smart city.
The ‘smart city’ concept aims at developing a comprehensive system that uses geospatial data to enhance the understanding of complex urban systems and to improve the efficiency and security of these systems. This geospatial data concerns (i) the urban built environment such as infrastructure, buildings and public spaces, (ii) the natural environment such as biodiversity, green spaces, air quality, soil and water, and (iii) urban services such as transport, municipal waste, water, energy, health and education. The smart city concept also aims at transforming the ‘silo-based’ management of cities into a ‘shared’ system that involves urban stakeholders in the design, realisation and evaluation of urban projects.

The emergent technology enables cities to achieve more agile management that improves the quality of life for citizens, enhances the economic development, improves the attractiveness of the city and reinforces the involvement of citizens in the city government. Indeed, the smart city concept provides the city managers with pertinent information about the performance of urban infrastructure and services, as well as users’ feedback. Analysis of this data allows policymakers and city managers to improve the efficiency of the urban system as well as the quality of urban services. This concept is particularly pertinent for the security and resilience of the city. It allows collection of data concerning how the city infrastructure and stakeholders respond to urban hazards. Analysis of this data provides greater understanding of the behaviour of urban systems (infrastructure, public services, emergency response, etc.) during urban crises or disasters, and consequently enables improvements to the city’s capacity to address the resiliency challenges. The smart city concept offers the possibility to confine a local fault and to prevent its spread to larger areas.
Use of GIS in smart city projects
The implementation of smart city projects is based on a number of steps (Figure 1) including the construction of the urban digital model, data collection using the sensing layer, then data analysis, interactive data visualisation and system control. GIS plays a role in these steps, as described below.
Construction of the urban digital model
The first step in the implementation of smart city projects concerns the construction of the urban digital model that describes the components of the urban built and natural environments. For each urban component, the digital model provides the geolocalisation and characteristics (attributes). GIS is generally used for the construction of the digital model of urban ‘horizontal components’ such as urban networks, transport facilities and natural environment, while building information modelling (BIM) is used for the description of ‘vertical components’ such as buildings. The combination of GIS and BIM provides a powerful tool for the construction of the urban digital model with georeferenced data and the visualisation of this data in a user-friendly environment.

Sensing layer
The second step in smart city projects concerns the construction of the sensing layer that transfers urban operating data to the smart city information system. This layer includes sensors used for monitoring urban networks and infrastructures. Data could also be enhanced by images, videos and audio files resulting in the construction of urban big data. Figure 2 shows examples of sensors used in monitoring water and energy utilities. The drinking water system uses automatic meter readers (AMRs) to record water consumption, pressure sensors to record water pressure and water quality devices to track the water quality (turbidity, pH, chlorine, conductivity). The drainage system uses sensors to monitor the water level and flow, water quality (turbidity, temperature, pH, etc.) and pumping equipment. It allows early detection of flood and faults in pumping equipment. The electrical grid uses sensors to measure the electrical tension, current and frequency. It allows early detection of faults in the electrical grid. The district heating system is monitored by sensors to record fluid temperature, pressure and flow as well as the state of the valve. It allows early fault detection and the improvement of the system performance. GIS offers the possibility to visualise the monitoring system as well as the sensors’ characteristics and status. It also provides the possibility to visualise real-time and historical data on GIS maps.

Data analysis
The third step in implementing a smart city project concerns the development of the analytic environment, which converts real-time and historical data into operational data that improves the security, efficiency and quality of urban systems. The analytic environment includes engineering, management and safety software for urban systems as well as advanced digital tools such as artificial intelligence (AI). In smart city projects, GIS provides tools for (i) geospatial data analysis (distance and directional analysis, geometrical processing, grid models), (ii) spatiotemporal analysis, (iii) spatial statistics (spatial autocorrelation and egression), (iv) surface analysis (surface form and flow analysis, gridding and interpolation methods) and, (v) location analysis (shortest path calculation, facility location).
Interactive data visualisation
Interactive data visualisation allows users to interact with the smart city’s components and the stakeholders in a user-friendly environment. Web applications are used to create this interactive environment. The use of HTML popups enables users to access web-based content such as graphics referenced by URLs. The interactive GIS graphic environment allows the visualisation of urban components and sensors maps. Users and managers can utilise these maps to access static and dynamic data concerning urban systems as well as to update the data.

Control layer
Data analysis of historical and real-time data results in commands for the optimal and safe management of urban systems. These commands are transmitted to the control layer, which includes different electronic devices such as smart valves, pumps, motors, switches, breakers and locks. The GIS system allows real-time visualisation of these devices as well as their status. It could also visualise faults in device command.
SunRise smart city project
The SunRise smart city project was aimed at the construction of a large-scale model of the smart city at Lille University’s scientific campus. The campus is equivalent to a small town, with 145 buildings, about 25,000 users and 100km of urban utilities.
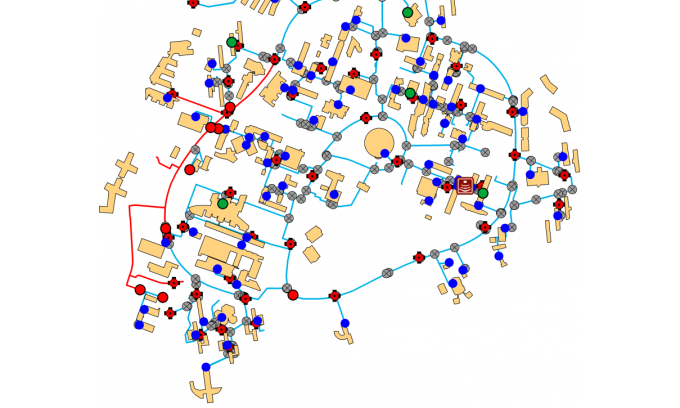
The first step of the SunRise project included the collection of asset data about the campus utilities and integration in the SunRise GIS system. The data concerned linear components such as pipes and lines and their attributes (diameter, material, age, etc.) as well as utilities-related equipment such as valves, hydrants, pumps, substations, manholes and tanks. Figure 3 shows the use of GIS for the electrical grid of the campus. The GIS map provides the grid architecture as well as attributes of the grid components including the electrical lines and substations. Figure 4 shows the GIS map of the storm-water system and the relevant equipment (valves, flow regulator, retention tank and lifting station).

The SunRise GIS system also included inspection and maintenance data. Figure 5 shows images of the video inspection of the sanitation system. For each component of this system, the management team can gain access to the maintenance history and reports including images and videos. The team can also conduct geospatial analysis of maintenance data for the optimisation of renovation and maintenance costs.
The monitoring system was also integrated in the SunRise GIS system. Figure 6 shows the smart monitoring of the drinking water network. It includes automatic reading meters (AMRs) for the water supply and consumption as well as pressure meters. The team manager can directly access information about the sensors and visualise the consumption history. The team can also compare the consumption of buildings and use data analysis to show abnormal consumption levels.
Conclusion
This article has presented the use of the GIS in the implementation of smart city projects. Since smart city projects are based on the collection, analysis, sharing and visualisation of data concerning urban systems and services, GIS provides powerful capacities for a successful implementation of such projects. GIS allows smart city managers to utilise a user-friendly and widely used digital system in the management of urban systems. GIS was used in the construction of the SunRise smart city demonstrator at the Lille University campus. The use of GIS facilitated effective cooperation between around 20 young researchers and the campus team management. GIS was used to store, share and analyse data concerning the campus utilities as well as their maintenance and monitoring.
Acknowledgement
The author would like to thank Nitivat Voraditee from Lille University for his contribution to this article.